If a host is repeatedly triggering a Canary with unexpected connection, a quick tip is to use a tool such as Microsoft's procmon to shed light on the responsible process.
This can be run on the host and filtered for traffic pointing towards the Canary.
Below is a quick guide on setting up ProcessMonitor to find the executable causing the alerts.
Process Monitor cannot show historical activity and will only identify processes that made a connection whilst procmon was running.
Step 1: Getting Procmon
Download Microsoft's Process Monitor from their sysinternals suite here.
Run the executable as administrator.
Step 2: Configuring Procmon
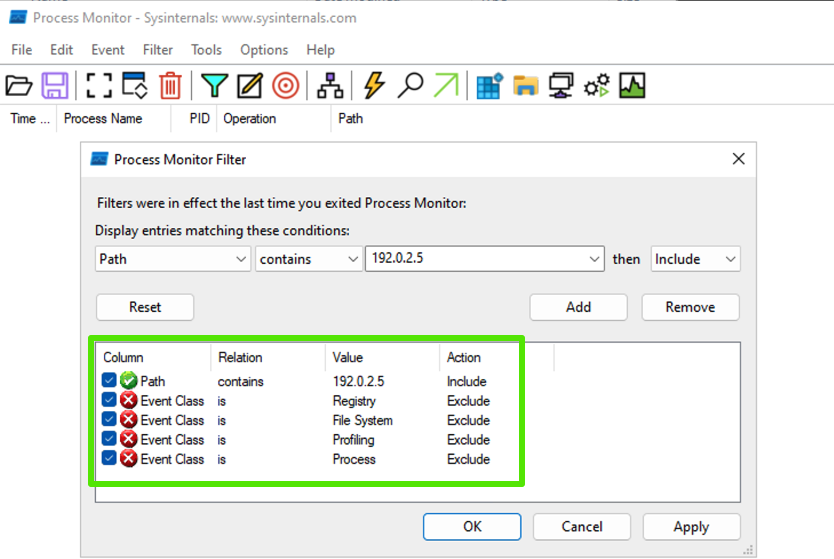
Upon opening, you'll be prompted with the filter window.
We'll need to customise our filters to find traffic destined for the Canary.
Match the filters to the below screenshot: (Replace the IP address 192.0.2.5 with your Canary's IP.).

Disable Show Resolved Network Addresses.
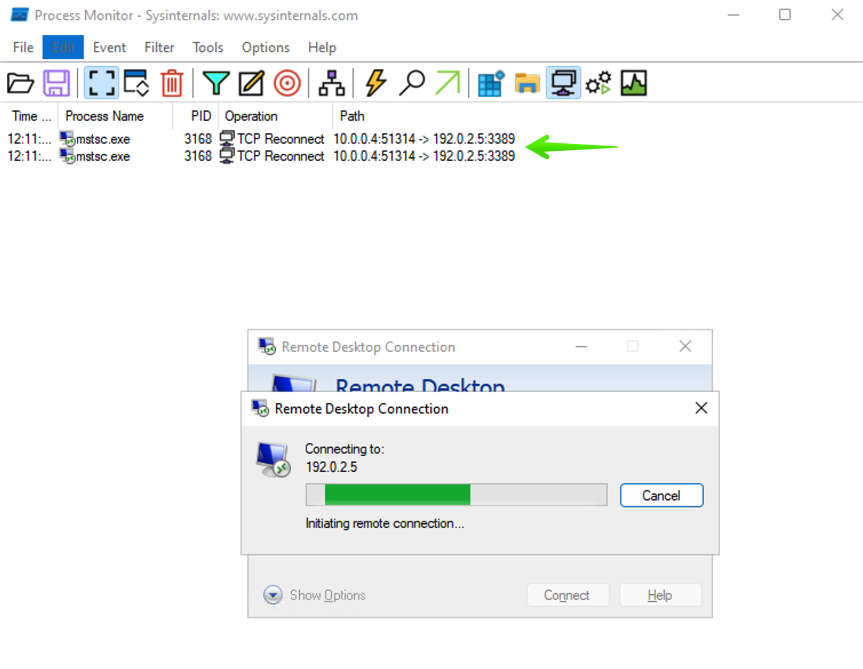
Step 3: Generating Test traffic
As a quick test, generate some test traffic by trying to connect to your Canary's IP address.
In our example, we'll use remote desktop.
Note that a ping won't generate logs as ICMP traffic is not logged.

You're all set! Applications generating traffic towards the Canary will be logged and shown in the window.
(Optional) Configure a log file
By default, Process Monitor writes events to the system page file.
If the capture needs to be run for an extended time, it's worth configuring a dedicated file on disk to write logs to.
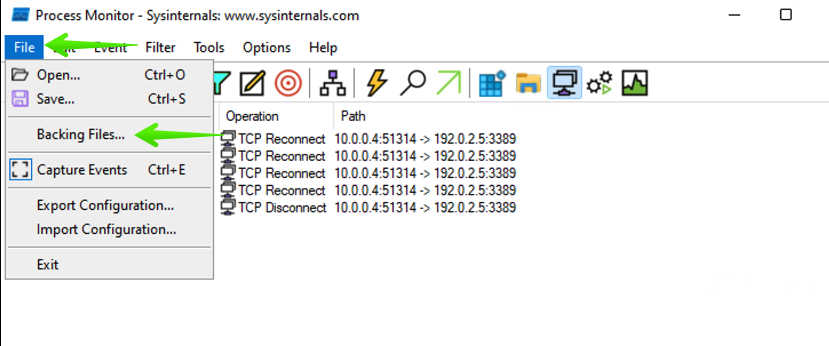
To setup a new Backing File, head over to the File drop down, then select Backing Files...

Change the backing file from Virtual Memory to a file with the following steps:
- Select Use file named.
- Open the file selection dialogue menu.
- Choose a preferred filename.
- Select the Save option.
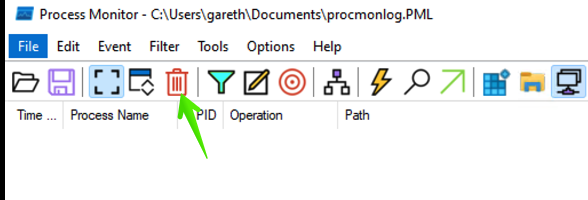
Restart the Capture session by clicking on the bin icon.
